

Interface Overview
The ProtSpace Explore page provides an interactive environment for visualizing and analyzing protein embeddings.
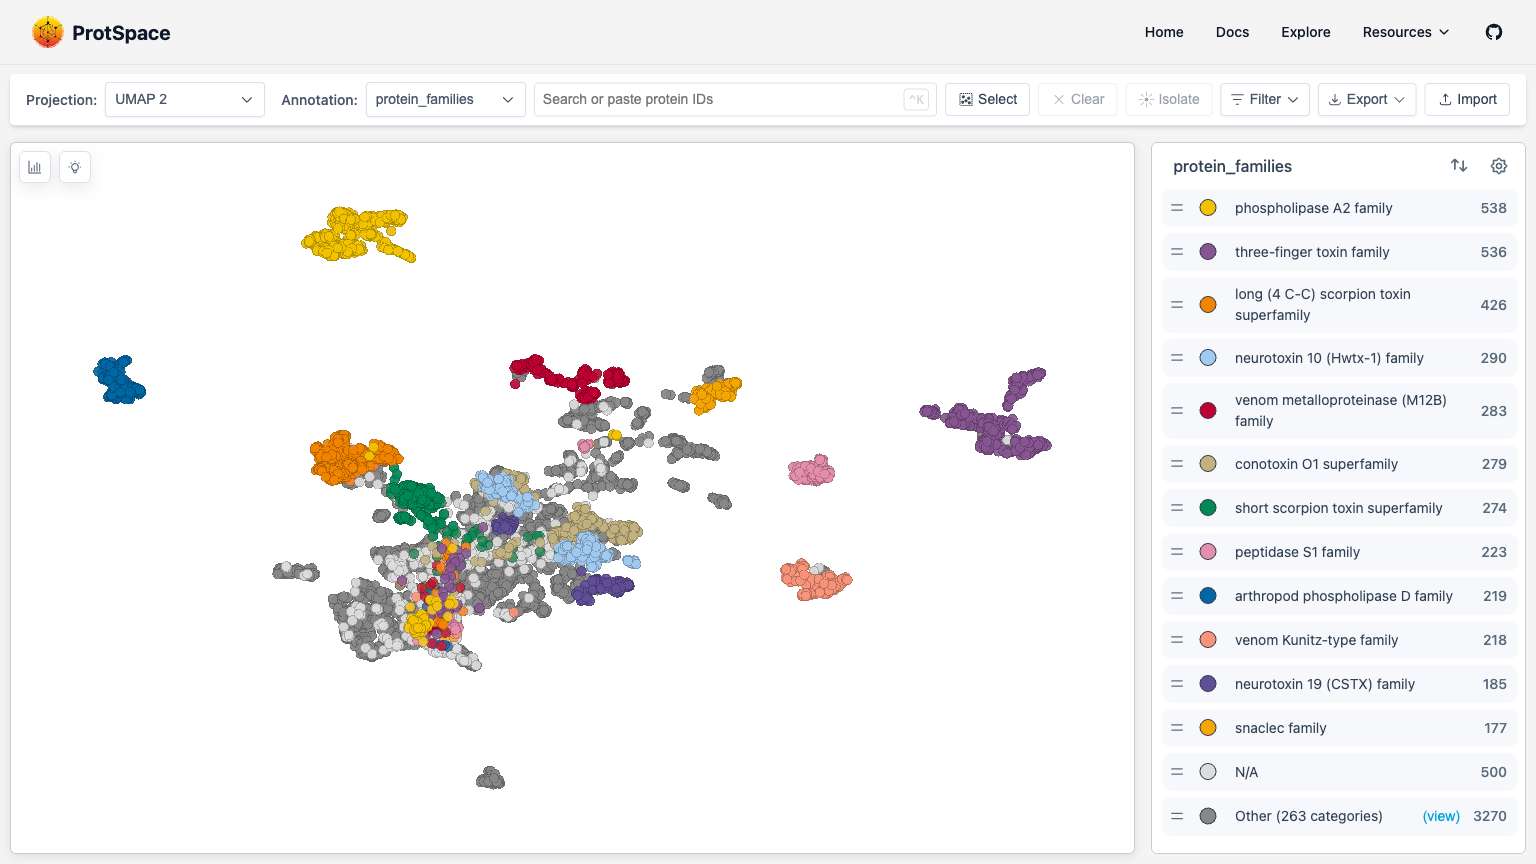
Page Layout
| Area | Location | Purpose |
|---|---|---|
| Control Bar | Top | Switch projections, change coloring, search, import/export |
| Scatterplot | Center | Main 2D visualization of protein embeddings |
| Legend | Right sidebar | Filter categories, customize display |
| Structure Viewer | Right sidebar | View 3D protein structures (when available) |
Control Bar

The control bar contains:
- Projection dropdown - Switch between PCA, UMAP, t-SNE
- Annotation dropdown - Color points by annotation
- Search box - Find proteins by ID
- Select button - Box selection mode
- Clear button - Clear selection
- Isolate button - Hide unselected proteins
- Filter button - Filter by annotation values
- Export button - Save images or data
- Import button - Load
.parquetbundlefile
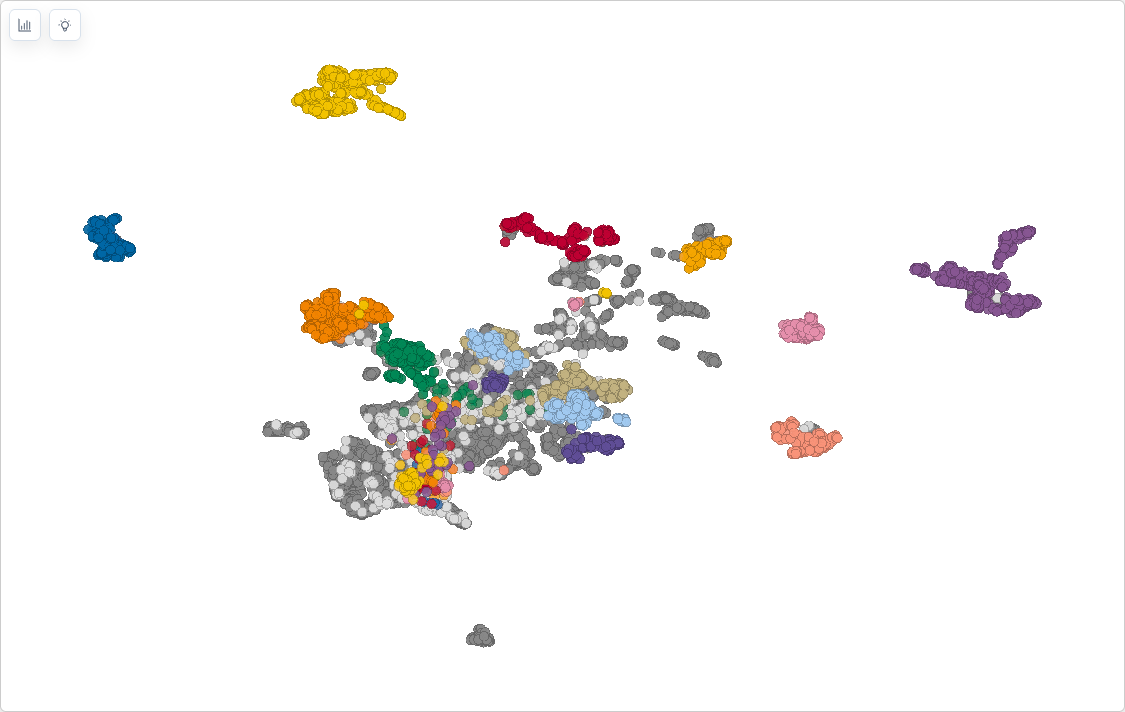
Scatterplot
The main visualization shows your proteins as points in 2D space. Points close together have similar embeddings.
Quick interactions:
- Scroll to zoom in/out
- Drag to pan around
- Click a point to select it
- ⌘/Ctrl + click to add to selection
- Double-click background to reset view
- Escape to clear selection / exit selection mode
- ⌘/Ctrl + K to focus search
Legend
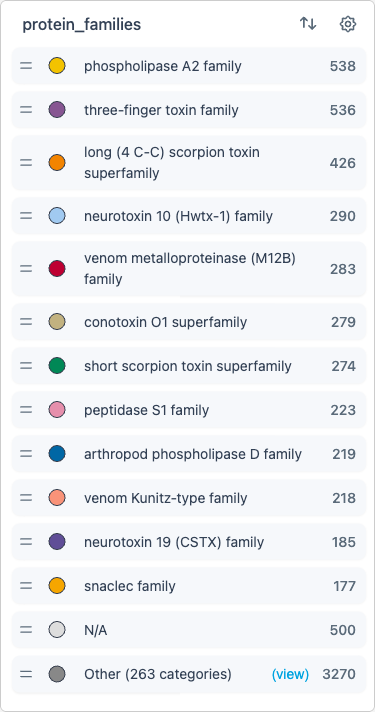
The legend shows the current coloring scheme:
- Click labels to hide/show categories
- Drag labels to reorder (changes drawing order in the scatterplot)
- Use the settings cog for advanced options
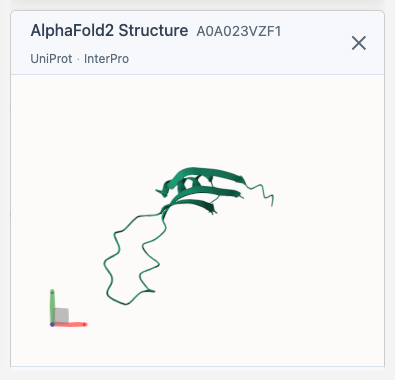
Structure Viewer
When you select a protein, the 3D viewer appears and fetches its structure from AlphaFold (if available). The viewer includes direct links to the AlphaFold Database, UniProt, and InterPro entries for the selected protein.
Next Steps
- Importing Data - Load your protein data
- Navigating the Scatterplot - Learn navigation controls
- Using the Legend - Filter and customize display