

Figure Editor
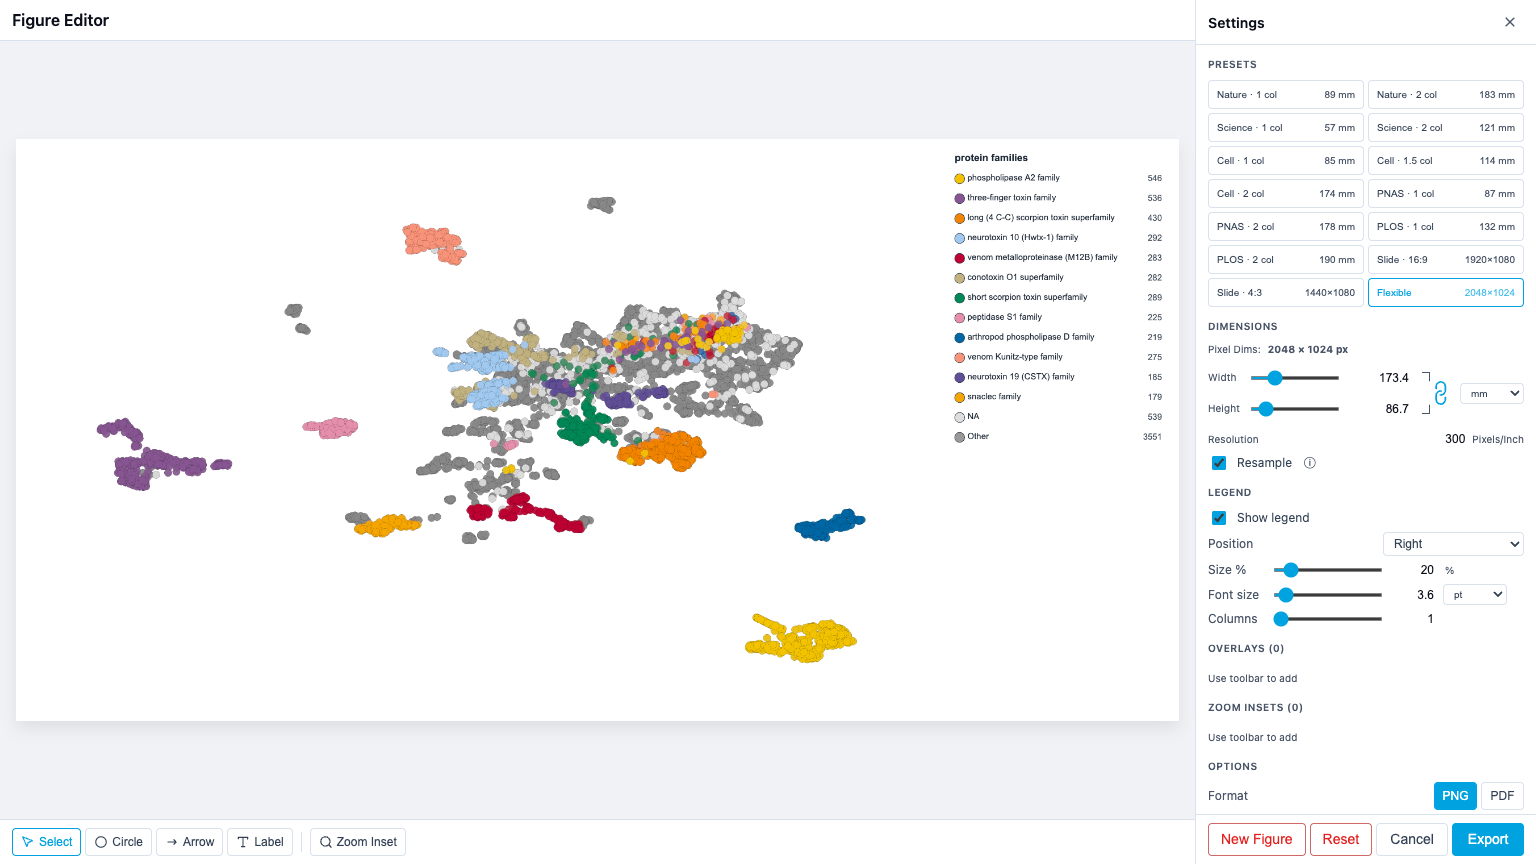
The Figure Editor is a full-screen tool for creating publication-ready figures from your ProtSpace visualization. It provides live preview, journal-specific dimension presets, overlays, zoom insets, and legend customization — all in a single interface.
Opening the Figure Editor
- Click Export in the control bar
- With PNG or PDF selected, click Figure Editor
The editor opens as a full-screen modal with a preview canvas on the left and a settings sidebar on the right.
To export immediately with the last-used settings, use Quick Export instead — it skips the editor.
Journal Presets
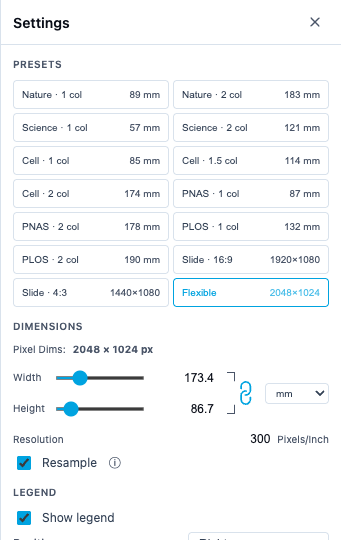
The presets grid configures dimensions and DPI for specific journals:
| Preset | Width | DPI | Max Height |
|---|---|---|---|
| Nature 1 col | 89 mm | 300 | 247 mm |
| Nature 2 col | 183 mm | 300 | 247 mm |
| Science 1 col | 57 mm | 300 | — |
| Science 2 col | 121 mm | 300 | — |
| Cell 1 col | 85 mm | 300 | 225 mm |
| Cell 1.5 col | 114 mm | 300 | 225 mm |
| Cell 2 col | 174 mm | 300 | 225 mm |
| PNAS 1 col | 87 mm | 300 | 225 mm |
| PNAS 2 col | 178 mm | 300 | 225 mm |
| PLOS 1 col | 132 mm | 300 | 222 mm |
| PLOS 2 col | 190 mm | 300 | 222 mm |
| Slide 16:9 | 1920 px | 96 | 1080 px |
| Slide 4:3 | 1440 px | 96 | 1080 px |
| Flexible | 2048 px | 300 | — |
When you apply a journal preset:
- Width is pinned to the journal's mm value. The Width input is disabled.
- Height stays adjustable up to the preset's max-height (where one is defined). Going beyond clamps to the cap.
- Your existing aspect ratio is preserved when possible. If the resulting height exceeds the cap, height clamps to the cap.
- The aspect-lock chain is disabled and shown as broken, because rescaling width to follow height would violate the preset.
- Resample is forced ON for the preset application. A small note appears if it had been off.
Pick Flexible to leave width and height fully editable.
Dimensions panel
The Dimensions section is modeled on Photoshop's Image Size dialog. Width and Height are linked through a chain icon, all values share a single unit, and a Resample toggle controls whether changing one value rebuilds pixels or only metadata.
Width / Height
Each has both a slider for quick adjustment and an input for precise values. The unit is whatever the Unit toggle is set to. Pixel range is 400 – 8192. While a journal preset is active, the Width input is disabled and any maxHeight cap clamps the Height.
DPI
72 – 1000 dots per inch. With a journal preset active, DPI is fully editable but Width-mm stays locked: changing DPI rescales Width-px to keep the same physical width.
Resample toggle
| Resample | What changing DPI does | What changing Width/Height does |
|---|---|---|
| ON | Rebuilds pixels at the new resolution | Pixels change, mm follows |
| OFF | Only metadata changes; pixels stay put | Pixels change, mm follows |
Use Resample OFF when you've already produced a figure at the right pixel count and just want to tag it with a different DPI for print sizing — no re-rendering.
When Resample is OFF and you click a preset, the editor auto-flips it back ON (a small note flashes) so the preset can apply.
Unit toggle
Switch the Width/Height inputs between px, mm, in, cm. Internally pixels are the source of truth; the unit only affects how values are displayed and entered.
Aspect-lock chain
The vertical chain icon between Width and Height links the two values. When locked (default), editing one rescales the other to preserve the aspect ratio. Click the chain to unlink.
The chain is automatically broken and disabled while a journal preset pins width — relinking is meaningless when one side cannot move. Switching to Flexible re-enables it.
Legend
Control how the legend appears in the exported figure:
| Setting | Range | Default | Description |
|---|---|---|---|
| Show legend | on/off | on | Toggle legend visibility |
| Position | right, left, top, bottom, free | right | Legend placement relative to the plot |
| Size % | 10–100% | 20% | Legend area as percentage of image width (or height for top/bottom) |
| Font size | unit-aware (see below) | ~15 px | Font size for legend text |
| Font unit | pt / px | pt | What unit the font-size input is in |
| Columns | 1–6 | 1 | Number of columns for legend items |
Font size unit (pt / px)
The font size input lets you type values in either pt (typographic points, what journals usually require) or px. The internal source of truth is pixels; pt is derived from the current DPI:
pt = px × 72 / DPIIf you change DPI later, pt-entered sizes stay correct in physical terms — the px count rescales automatically.
Legend positions
- Side positions (right, left, top, bottom) — the legend occupies a dedicated strip alongside the plot. The plot area shrinks accordingly.
- Free — the legend floats over the plot. Drag it anywhere on the canvas using the Select tool.
Legend rendering
- Underscore removal — underscores in annotation names and category labels are replaced with spaces.
- Text wrapping — long category labels wrap within their column width.
- Per-item shapes — the legend renders each category's actual shape (circle, square, diamond, triangle-up/down, plus), matching the scatterplot.
- Corner positions (tr, tl, br, bl) — available programmatically; the legend overlays the plot with a semi-transparent white background.
Selecting items (canvas + sidebar)
Selection is a single concept that the canvas and sidebar share. An item is either selected or it isn't, and exactly one item can be selected at a time.
You can select an item in three ways:
- Click it on the canvas with the Select tool
- Click its row in the sidebar under "Overlays" or "Zoom Insets"
- Drag a handle on the canvas (this implicitly selects)
The selected item is highlighted in the sidebar and gets resize/rotate handles on the canvas. Click empty canvas to deselect.
Removing items
| Key | Effect |
|---|---|
| Delete or Backspace | Remove the currently selected overlay or inset |
| Escape | Clear the selection (item stays) |
| × button on a sidebar row | Remove that specific row, regardless of selection |
While focus is inside an editable input (e.g. a label's text field), Delete/Backspace edit text as usual — they don't remove the overlay.
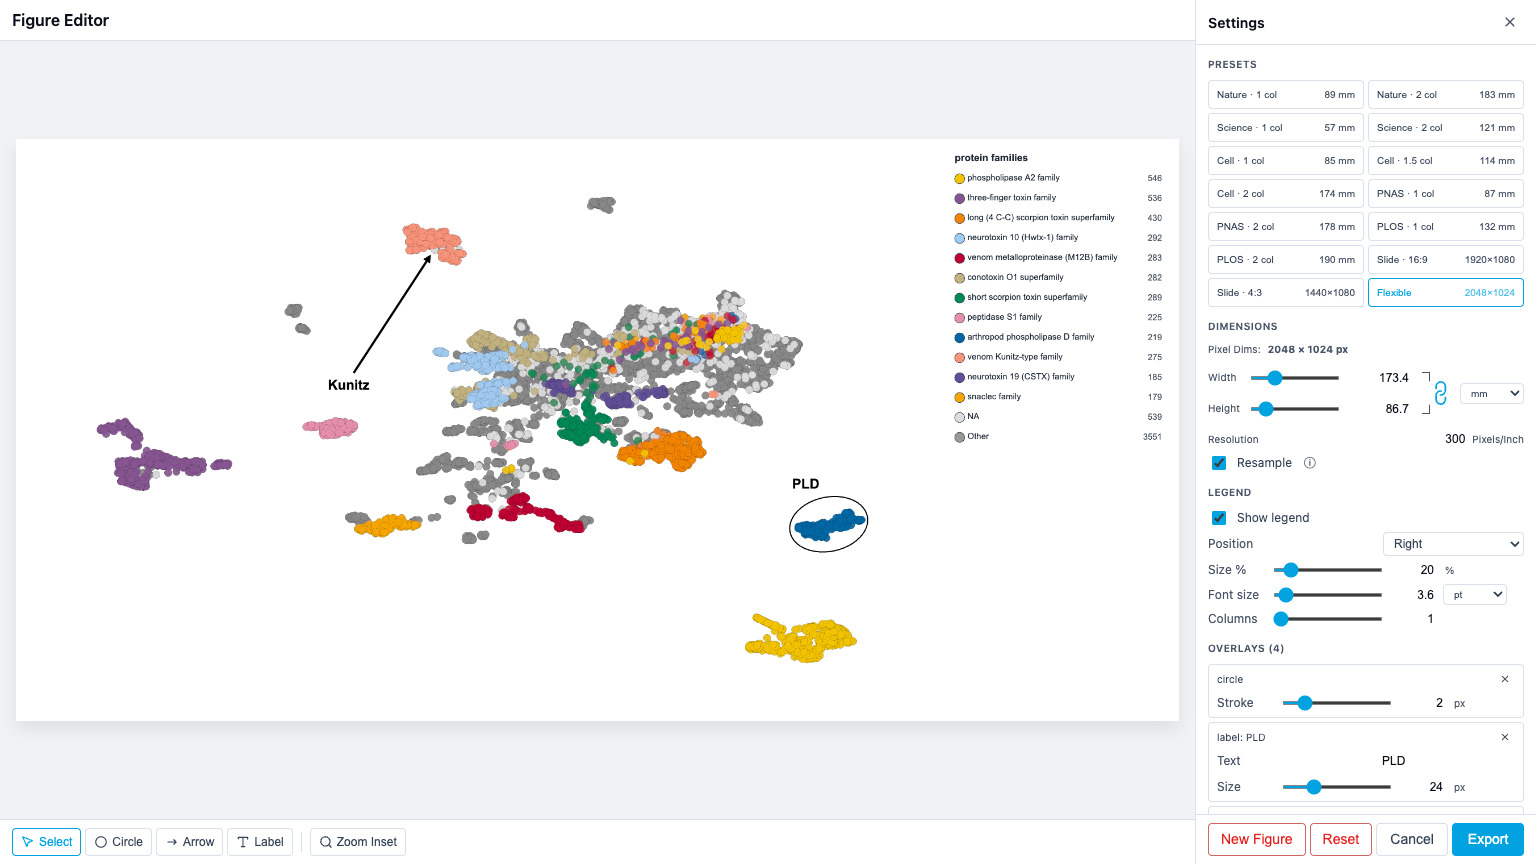
Overlay tools
The toolbar at the bottom of the preview switches between drawing tools.
Select tool
Click items on the canvas or in the sidebar to select them. Drag a selected item to move it. Drag handles to resize or rotate. See Selecting items above for keyboard shortcuts.
Circle tool
Click and drag to draw an ellipse. The center is placed at mouse-down, radius extends to release. After creation, the Select tool exposes:
- 4 cardinal handles to resize rx/ry independently
- A rotate handle (above the top handle) to rotate the ellipse
- The body to drag the whole shape
Arrow tool
Click and drag from start to end. The arrowhead appears at the end point. After creation, the Select tool exposes:
- Circle handles at each endpoint to reposition
- The shaft to drag the whole arrow
Label tool
Click to place a text label. Default text is "Label" and can be renamed in the sidebar. After creation, the Select tool exposes:
- The body to drag
- A rotate handle for rotation around the anchor
Zoom-inset tool
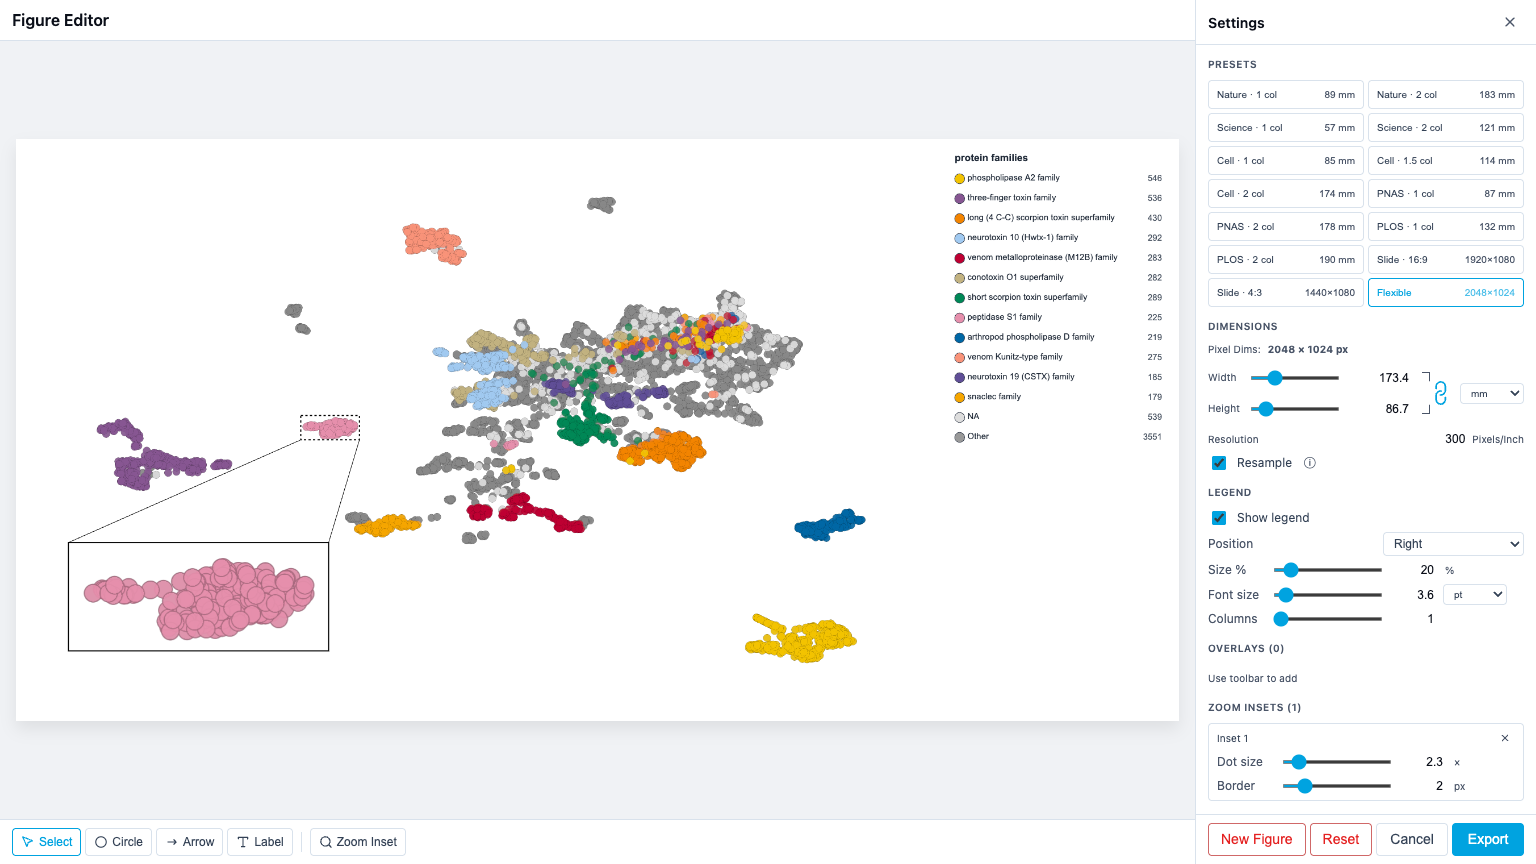
Creates a magnified view of a region. Two-phase workflow:
- Draw the source rectangle — drag to select the region you want to magnify
- Draw the target rectangle — drag to place where the magnified view should appear (its aspect ratio locks to the source)
After creation, the inset shows:
- A dashed outline around the source region
- The magnified content in the target rectangle with a solid border
- Connector lines between the closest corner pair
The connector logic auto-picks 2 of the 4 corner pairs based on the relative position of source and target.
Geometric zoom (true vector-quality magnification)
Insets are rendered as a fresh WebGL pass scoped to the source's data domain at the target rectangle's exact pixel size. Points keep native pixel size — the inset is not a raster crop-and-upscale, so quality keeps improving as the inset's pixel budget grows instead of plateauing at a fixed boost factor.
While you drag-resize an inset, redraws are throttled to the browser's animation frames. Very fast resizes reuse the last fresh render (slightly stretched) for instant feedback, then a fresh full-resolution render is computed once activity settles.
Dot size slider
Each inset has its own Dot size slider (0.5×–20×, default 2×) that scales the rendered dot size inside the zoomed view, relative to the main plot:
- 1× — dots match the main plot's pixel size
- >1× — dots are larger, useful when you've zoomed deep into a sparse region
- <1× — dots are smaller
This affects the inset only, not the main plot.
Per-overlay properties
Each overlay row in the sidebar has editable properties:
| Overlay | Properties |
|---|---|
| Circle | Stroke width (0.5–10 px) |
| Arrow | Stroke width (0.5–10 px) |
| Label | Text content, font size (8–72 px) |
| Inset | Dot size (0.5×–20×), Border (0.5–10 px) |
All overlays default to black (#000000). Click the row to select it; click the × button to delete it.
Options
- Format — toggle between PNG and PDF output
- Background — white or transparent (PNG only; PDF always has a white background)
PNG output
Exported PNGs include a pHYs chunk encoding the configured DPI. Image editors (Photoshop, Illustrator, Inkscape, GIMP) will open them at the correct physical size for print.
PDF output
The PDF page size is computed exactly from the configured Width/Height in mm at the configured DPI, so the document opens at the intended physical dimensions in any PDF viewer.
Footer buttons
| Button | Action |
|---|---|
| New Figure | Clears all overlays and insets but keeps layout settings (dimensions, DPI, preset, legend, format). Useful when you've changed the underlying visualization and want a fresh canvas. |
| Reset | Resets everything to defaults — dimensions, DPI, preset, legend, overlays, insets, format, background. |
| Cancel | Closes the editor. Your current state is saved to localStorage. |
| Export | Renders the figure at full resolution and downloads it. State is saved to localStorage. |
State persistence
The Figure Editor saves your settings automatically so you can close and reopen without losing work.
Where state is stored
- localStorage — saved on every close and export. Restored when you reopen the editor in the same browser.
- Parquet bundle — when you export a
.parquetbundlewith "Include legend settings" checked, the Figure Editor state is included. Anyone who loads the file gets your figure layout.
Priority on open: bundle settings > localStorage > defaults.
What is saved
All settings persist: preset, dimensions, DPI, format, background, resample, aspect-lock, unit, legend layout (position, size, font, font unit, columns, free position), overlays (type, position, properties), insets (source rect, target rect, border, connector, dot-size scale), and the reference width for overlay scaling.
Saved state passes through a sanitizer on load: malformed entries (out-of-range coords, unknown overlay/preset types, non-finite numbers, dimensions above the canvas cap) are dropped or replaced with defaults rather than crashing the editor.
View fingerprint
The editor records which projection and dimensionality (2D/3D) was active when overlays were placed. If you change the projection or dimensionality between sessions, a warning appears:
"Overlays were placed on UMAP 2D. Current view: PaCMAP 2D."
This means overlay positions (stored as normalized 0–1 coordinates over the plot area) may no longer align with the data. You can:
- Keep working — overlays stay where they are
- Clear overlays — remove stale overlays, keep the layout
Coordinate system
All overlay and inset positions use normalized 0–1 coordinates within the plot area:
- Overlays survive resolution changes (switching presets, changing width/height)
- Overlays survive DPI changes
- Overlays do not survive projection changes (the data moves, but overlay positions don't)
Pixel-based properties (stroke width, font size) are scaled proportionally when the output width differs from the width at which they were authored (referenceWidth).
Keyboard and mouse
| Action | Effect |
|---|---|
| Click overlay backdrop | Close the editor |
| Click × in sidebar header | Close the editor |
| Click toolbar button | Switch active tool |
| Click sidebar overlay/inset row | Select that item |
| Click an item on the canvas | Select that item |
| Delete / Backspace | Remove the selected item (skipped while typing) |
| Escape | Clear the selection |
| Drag on canvas (drawing tool) | Create overlay/inset |
| Drag on canvas (select tool) | Move selected item |
| Drag handle (select tool) | Resize/rotate selected item |
| Drag legend (free position) | Move legend on canvas |